How do we measure the prediction quality of regression?
After we have built the model, it is important to evaluate it to check how
it will perform on the new, unseen data. Evaluation confirms whether
the model has learned all the patterns hidden in the dataset properly. By
using an evaluation metric, we can evaluate the difference between the
predicted value and the observed result value. It confirms how close the
prediction is to the observed value. It is essential to check whether our
model is a reliable model and free of any biases.
This article discusses various metrics that can be evaluated to
check the performance of a regression model when target
variable is of continous type .
Below are the various metrics that can be evaluated to check the
performance of the prediction of a linear regression model.
MAE (mean absolute error )
MSE (mean squared error)
RMSE(Root mean squared error)
R²
Adjusted R²
In this story, we will discuss MAE ,MSE and RMSE evaluation metrics
and rest will be discussed in the next story of the series, to keep the story
concise.
Mean Absolute Error (MAE) is the average of the absolute
difference between the predicted value and the actual value . It works by
finding the difference between the actual value, y and the predicted
value y`. This gives us the residual. Then the absolute value for each
residual is calculated. The average of all the residuals is finally
calculated.
Formula to calculate MAE
MAE gives the output in the same units as the target variable. So this
metric is interpretable. The output suggests how far the predictions are
from the actual values on average.
Suppose the temperature is predicted to be 20 degrees, when the actual
values are 19 degrees. The value of 1 in MAE suggests that the prediction
is 1 point away from the exact value. It does not describe the direction of
the difference — whether the prediction is one point forward or one
point backwards from the actual value. It only describes the magnitude
of the difference.
Mean Squared Error(MSE) is the average of the squared
difference between the predicted value and the actual result value. It
works by finding the residual, squaring each residual term, then taking
out the average of the squared residuals.
Formula to calcuate MSE
It magnifies the large errors due to squaring. Squaring 2 becomes 4,
while 4 becomes 16. Here, the error magnitude of 4 is more emphasised
after squaring it. Thus, MSE is sensitive to outliers. It should be used
when it is important to emphasise large errors. For example, in critical
cases like medical diagnosis, earthquake prediction and fraud detection ,
we can not ignore large errors. Thus, MSE is preferred in these cases.
In table below, the observed result y and the predicted result y` for earth
earthquake prediction model are given:
Sample data from earthquake prediction model
Suppose we are predicting earthquake magnitude. A small increase in
magnitude has a more drastic effect . In the table above,
magnitude of 5 is predicted -> 6.5.
difference -> 1.5
On squaring -> 2.25.
Second data point :
7 is predicted -> 4.5.
difference -> 3.5
On squaring -> 12.25
Thus, second data point has an error of 3.5 ,which is larger than the first
data point. Here we find that a large error becomes much larger after
squaring. In this way, MSE gives more weight to large errors.
The earthquake magnitude of 7 is very disastrous and should have been
predicted well to save many lives. But here it is predicted to be 4.5,
which is said to be a very light earthquake. This is really not good
prediction for a life-saving application. Thus, we can conclude that our
model’s performance is worse.
Here, MSE gets a higher value because of one large error. It also
demonstrates that it is sensitive to outliers. Here, large errors are
magnified due to squaring.
A disadvantage of MSE is that it is less interpretable than MAE, as the
unit of the target variable is changed when it is squared.
MAE does not impose much penalty, as no squaring is involved in its
formula. It treats large errors and small errors equally.
Root Mean Squared Error(RMSE) returns the metric value in the
same unit as the target variable. It works by finding the residual by
taking out the difference between y and y`, squaring the difference,
averaging them and then taking the square root.
Formual to calculate RMSE
Like MSE, it also penalises the large errors due to squaring. Thus, it is
also sensitive to outliers and should be used for critical data where we
cannot ignore large errors.
Thus, it has the benefits of both MAE and MSE. Like MSE, it penalises
large errors more heavily, while also retaining the interpretability of
MAE. You can use RMSE when you need to magnify large errors more
than the small errors, and at the same time, also want to interpret the
result easily.
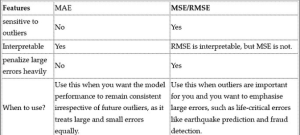
Below table clearly explains the difference between MAE, MSE and
RMSE and which to use when.
Table differentiating MAE and MSE/RMSE
Now, how can you decide whether our metric (MSE or MAE) is large or
small? It depends on the magnitude of the data point and the type of our
data. For example, in the case of fraud detection, if y is 25,000 and the
predicted value y`is 40,000. The difference is 15000. Squaring it, we get
225,000000. This is a massive penalty. Thus, we can conclude that our
model needs improvement.
In the next story of this series, we will look at other evaluation metrics
such as R² and adjusted R².
Ready to go deeper? Explore our course catalog at TuxAcademy.org and start building skills that actually matter.
Nearby Landmarks & Localities for TuxAcademy (Greater Noida West) Offline Courses:
TuxAcademy is strategically located in the heart of Greater Noida West, making it easily accessible from several prominent residential hubs and landmarks. We are close to Gaur City, one of the largest residential townships in the region, and well-connected to Noida Extension. Our center is also conveniently accessible from Bisrakh and Techzone 4, making it ideal for students from nearby sectors. We are located near the popular Ek Murti Chowk, a key junction that connects multiple sectors and ensures smooth commuting. Additionally, students from Sector 1 Greater Noida West, Sector 16B Greater Noida West, and Crossings Republik can easily reach us. This prime location makes TuxAcademy a convenient choice for learners across Greater Noida West and nearby areas.
Resources:
To deepen your understanding and explore more career-focused programs, you can visit the following pages:
- https://www.tuxacademy.org/
- https://www.tuxacademy.org/data-science-course
- https://www.tuxacademy.org/blog
These resources will help you move from learning concepts to building a successful career.